How to Measure Guest Engagement at a Corporate Event (With Photo Participation as a Metric)

You signed off the budget. You booked the venue, the catering, the AV crew, the keynote speaker. The event ran. People showed up, the room felt busy, the post-event survey came back broadly positive — and now someone on the leadership team asks the one question that always lands after the invoices: did it work?
"It felt great" is not an answer a procurement-minded organisation can act on. "We had 312 attendees" is a headcount, not an engagement figure — a full room of people checking email is not the same as a full room of people taking part. What you actually need is a small set of measurable signals that tell you whether the people in the room were involved, captured during the event itself rather than reconstructed from memory two weeks later.
This guide lays out a practical framework for measuring guest engagement at a corporate event, and makes the case for one underused, low-effort, leading-indicator metric most organisers ignore: photo participation — the share of your attendees who actively contributed media during the event. It is one of the few engagement signals you can collect passively, in real time, without sending a single follow-up message.
A note on scope: this is a measurement guide, not legal advice. Where we touch GDPR, we cite the regulation; for anything binding, run it past your own DPO or counsel.
Engagement is one of those words everyone uses and few define. At a corporate event it usually collapses into one of three things that are easy to confuse:
The stakes are not trivial. Engagement at work is one of the most heavily studied links to business performance there is: Gallup's Q12 meta-analysis — drawn from 736 studies across 347 organisations, covering 183,806 business units and more than 3.3 million employees — found that business units in the top quartile for engagement outperform the bottom quartile by 23% in profitability, 18% in productivity (sales), and 14% in productivity (production records and evaluations) (Gallup, Q12 Meta-Analysis, 11th edition, 2024). Internal events are one of the levers organisations pull to build that engagement. If you are going to spend on them, you should be able to measure whether the room was actually in it.
The problem is that the richest engagement signals have historically been the hardest to capture. You can station a person with a clipboard. You can run live polls and count responses. You can — and this is where it gets uncomfortable — deploy face-recognition cameras to track dwell time and "attention." That last option is not just heavy-handed; under EU law it crosses a bright line we will come back to. The good news is that one of the strongest leading indicators is also one of the cheapest to collect, and it sits in your guests' pockets already.
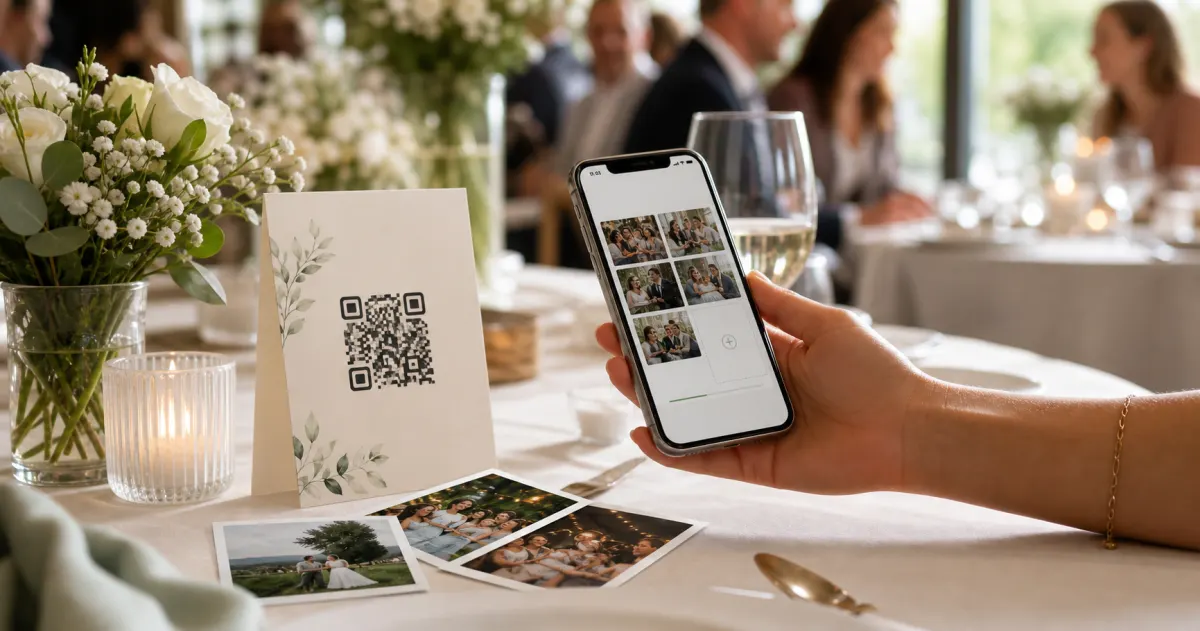
Here is the underused idea: the percentage of your attendees who voluntarily upload a photo, video, or voice message during the event is a clean, real-time proxy for active participation.
Think about what it takes for a guest to contribute media. They have to be present, paying enough attention to notice something worth capturing, motivated enough to point a phone at it, and comfortable enough with the experience to share it. A bored attendee does not upload. A disengaged room produces silence. Photo participation is, in effect, a vote with the camera — and unlike a satisfaction survey, it is cast during the moment, not remembered afterwards.
It also avoids the two big failure modes of other engagement signals. It is not retrospective, so it does not depend on who fills in the form. And — done correctly — it does not require you to surveil anyone, because you are counting voluntary contributions, not tracking faces or movement.
Why does this work in practice now, when it might not have a decade ago? Because the friction is gone. QR codes have reached genuine mainstream adoption — 68% of US consumers report having used a QR code in the past year (TEAM LEWIS, Consumer Perceptions of QR Codes, 2024) — and smartphone ownership is effectively universal in core European markets, with smartphone penetration in Germany forecast at around 97% (Statista, 2024). When the entry cost is "point your camera at the sign on your lanyard," participation stops being a chore and starts being a reflex.
A worked illustration. Suppose two of your regional offsites both report 200 attendees and both come back with survey scores around 4.2 out of 5. On paper, identical. But Offsite A logged contributions from 130 of those 200 attendees; Offsite B logged 28. That gap is information a headcount and a survey average would have hidden entirely — it tells you which room was actually leaning in, and it gives internal comms a concrete signal about which format, agenda, or location to repeat. (Figures here are an illustrative example, not a benchmark.)
A word on the "94%" you'll see quoted. Plenty of event-tech marketing — including some of Gathmo's own early material — throws around figures like a "94% guest participation rate." Treat any such number, ours included, as an aspirational marketing claim, not an industry benchmark. There is currently no credible, independent, published dataset establishing a "normal" photo-participation rate for corporate events. The honest move is to measure your own baseline and track it over time, rather than chase someone else's headline figure.
Photo participation is one metric, not the whole picture. Use it as part of a small, honest scorecard. Here is a framework that balances effort against insight, ordered roughly from easiest to richest.
1. Attendance rate (baseline, not engagement). Registered vs. actually present. Necessary as a denominator — you cannot compute a participation rate without it — but never mistake it for engagement on its own.
2. Photo participation rate (your leading indicator). Unique contributors ÷ attendees. The single most useful real-time signal in this list. Measure it per event and watch the trend across your event programme; the trend is more meaningful than any single number.
3. Contribution volume and pacing. Total items uploaded, and when they were uploaded. A spike during the keynote vs. a flatline during a breakout session tells you which moments earned attention. Pacing data effectively gives you an engagement timeline of the day.
4. Live-moment interaction. If you run a live photo wall or slideshow on screen, the fact that people keep contributing to be seen on it is itself an engagement loop. Watch whether uploads rise after the wall goes live.
5. Post-event reach. How many attendees open or download the final branded album. This measures whether the event had a tail — whether people cared enough to come back for the media after the room emptied.
6. Survey and qualitative feedback (lagging, but still useful). The traditional post-event survey. Keep it — but read it alongside your participation data, not instead of it. A high satisfaction score with near-zero participation is a flag worth investigating, not a clean win.
The discipline that matters: pick three or four of these, define them the same way every time, and measure them consistently. A rough metric tracked consistently beats a perfect metric tracked once.
The mechanics are deliberately boring, which is the point — low friction for guests, low effort for you.
Crucially, this approach measures participation by counting voluntary uploads — not by identifying or tracking individuals. That distinction is not a nicety. It is the difference between a metric your legal team will wave through and one they will stop at the door.
Because in the EU it is the wrong tool for this job, on both legal and trust grounds.
Under the GDPR, a photograph of a face is not automatically special-category data. It becomes biometric data — and triggers the heightened protections of Article 9 — only when it is "processed through a specific technical means allowing the unique identification or authentication of a natural person" (GDPR Recital 51; Art. 9(1)). Plainly: an ordinary photo gallery does not engage Article 9, but a system that runs facial-recognition matching to identify people, track dwell time, or measure "attention" does — and that generally requires a separate, explicit legal ground such as explicit consent. For a routine corporate event, deploying biometric surveillance to manufacture an engagement number is disproportionate, hard to justify, and corrosive to the very trust you are trying to build.
For the record: Gathmo does not offer face recognition. AI-based face-find is on the roadmap as a Phase 2 feature and is not part of the launch product — and even when it arrives, it is for helping guests find their own photos, not for surveilling a room. Measuring engagement by counting voluntary contributions sidesteps the entire Article 9 question. You get a real signal; nobody gets tracked.
Engagement measurement built on voluntary photo participation is one of the more privacy-friendly approaches available, but a few GDPR points still apply — especially when your "guests" are your own employees. Briefly, and again, not legal advice:
This is also where where your data lives stops being abstract. Gathmo hosts EU event data in the EU — Postgres in Frankfurt and EU-jurisdiction object storage, with Data Processing Agreements in place with its processors — and a DPA is available on request. If you are weighing tools, note that several popular competitors are US-based, with EU data residency not confirmed for European customers; for a guide focused on engagement that's a footnote, but for your procurement team it is often the first question. (We compare the field on this in our hub guide to event photo-sharing apps.)
Frequently asked
Combine a small, consistent set of signals rather than relying on one. A practical scorecard: attendance rate (as a baseline denominator), photo-participation rate (your real-time leading indicator), contribution volume and pacing, live-moment interaction, post-event album reach, and a post-event survey read alongside the behavioural data. Define each the same way every time and track the trend across events.
There is no reliable published benchmark, and you should be sceptical of any vendor — Gathmo included — that quotes a specific headline figure as an industry norm. The useful move is to measure your own baseline at your next event and improve on it. A trend you own beats a benchmark you borrowed.
Yes — and you should. Counting voluntary photo, video, and voice contributions gives you a genuine participation signal without identifying or tracking anyone. This avoids facial-recognition and dwell-tracking approaches that, in the EU, trigger the biometric-data provisions of GDPR Article 9 and the heightened obligations that come with them.
It is a leading indicator, not a vanity number — provided you measure it as a rate (unique contributors ÷ attendees) and watch it over time. A raw upload count is a vanity number; a participation rate trending up across your event programme is a signal that your formats are landing.
Often, yes — and it is the safer path. Ordinary event photos can sometimes rest on legitimate interest (GDPR Art. 6(1)(f)), but in the German employment context (BDSG § 26) freely-given, documented consent with a real right to decline is typically advisable for staff. This is a "check with your DPO" question, not a "read a blog" one.
 Guide
GuideHow to collect photos from your event guests (the easy way)
A printed QR code on the table collects more photos than any link in a group chat -- here is why, and how to set one up in two minutes.
 Story
StoryThe most underrated wedding keepsake: guest voice messages
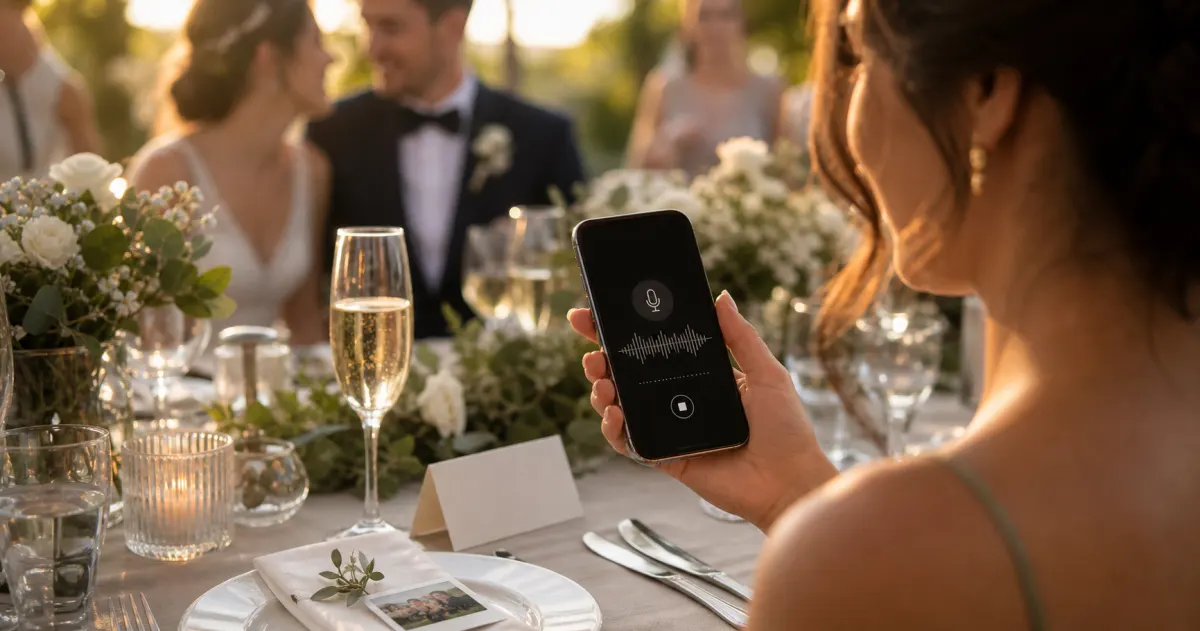
Photos freeze a face; a voice keeps the person. Why recording short voice notes from guests is the memory couples treasure most.
 Guide
GuideCollecting guest photos in the EU without the GDPR headache
Consent, data residency, and erasure -- the three things that make event-media GDPR-compliant, and how to get them right by default.